Thursday, January 30, 2014

Who Will Win the 2014 Super Bowl?

Here is this year's "Who Will Win" article for the Super Bowl.


Together with Dr. Jay Granat, a psychotherapist, I studied factors related to sports psychology to help predict the winner of the Super Bowl. The results are based on every Super Bowl ever played since the first Super Bowl in January 1967.

This year’s Super Bowl between the Denver Broncos and the Seattle Seahawks is a classic matchup between offense and defense.

Read more here for the Quant Fact predictions at http://www.rantsports.com/nfl/2014/01/30/2014-super-bowl-who-will-win-the-big-game/?3pt1yM4RgIXAaI26.99


If you are in a Super Bowl Square Pool, check out our updated odds for this year's Super Bowl.
http://www.rantsports.com/nfl/2014/01/27/2014-super-bowl-square-pool-probabilities-by-quarter/

Monday, January 27, 2014

Super Bowl Square Pool Odds, by Quarter (2014)

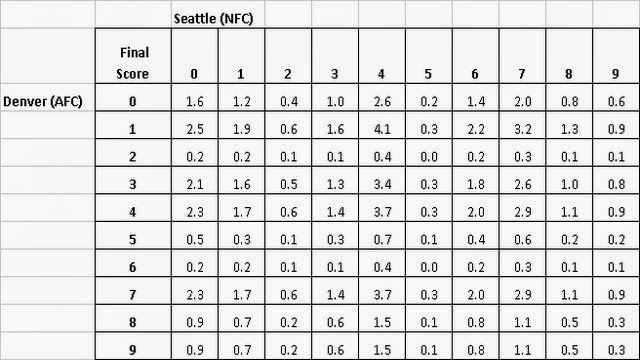
Are you in one of those popular Super Bowl Square Pools?  Here are the probabilities of your numbers winning, for the final score.  In the link below, we also compute the probabilities for the square pool winner for each quarter.  

Quant facts
Square Pool Probabilities - Final Score

If you are participating in a square pool (where only the last digit for each team counts), you will be randomly assigned a digit for each team, such as the Seattle Seahawks (or NFC) 3, and the Denver Broncos (or AFC) 4. Many fans have an idea of what numbers are “good.” Here, we compute square pool probabilities, or odds, based on historical results by quarter.

Most people know that numbers like 7, 3, and 0 are good, due to the key numbers associated with touchdowns and field goals. But how good are these numbers? And what about the 4, 6, or 1? Several years ago, I computed the probabilities of the digits winning for each quarter – based on every Super Bowl ever played. The results were published by the New York Times, in their Super Bowl Sunday spread print edition.


Read more at http://www.rantsports.com/nfl/2014/01/27/2014-super-bowl-square-pool-probabilities-by-quarter/?YhoBfZegjGmcc7rJ.99


Carlton Chin is a fund manager, quant researcher, and sports analytics contributor to Rant Sports.  He has also contributed to the New York Times, Wall St. Journal, and ESPN.  Don La Fronz is a financial advisor and originated the idea for this piece.

Wednesday, January 22, 2014

Article on Monte Carlo and Carlton Chin

We noticed this article on Monte Carlo analysis and our work on sports analytics.


You know something has entered the realms of popular culture when everybody speaks about it in the same breath as Hollywood blockbusters, their tax bills or smartphones. Well, OK… Monte Carlo analysis hasn’t quite made it that far, but it has cropped up in connection with women’s tennis championships, and a number of other sports as well. Carlton J. Chin (portfolio strategist and fund manager when he’s not analyzing sports events) applied Monte Carlo analysis to forecast the results of the 2013 US Open Tennis and the Women’s Singles in particular. So what were his predictions – and, more to the point, was he right?
Sample statistics for men's tennis this time
Image source: tennismindgame.com
The Method Behind the Monte Carlo Madness
Chin asserts that sports are often good candidates for Monte Carlo Analysis because they are marked by specific events: in tennis, such events are, for instance, holding or breaking serve. He used the ability of certain players to hold or break serve drawing on statistics from the rest of the year. Then he used a Monte Carlo analysis in a simulation of thousands of games between these players. His forecasts were that Serena Williams had a 62.3 per cent chance of winning, followed by Victoria Azarenka (16.2 per cent) and Li Na (10.8 per cent). In general, his predictions held good, barring some US Open position upsets like Flavia Pennetta (0.5 per cent) beating her fellow Italian Robert Vinci (6.4 per cent) in the quarter finals.


- See more at: http://decision-analytics-blog.lumina.com/monte-carlo-simulations/monte-carlo-analysis-goes-mainstream-with-womens-tennis/#sthash.ybtt9TZe.dpuf

Tuesday, January 21, 2014

Quant Facts now 36-23 (61.0%)

Thank you to those who commented how close our Monte Carlo simulations were to the final BCS score.  Our sports psychology factors predicted a very close game -- and selected the underdog, Auburn, in a 35-34 victory.  Florida State, a heavy favorite (about -9 points), stormed back from a 21-3 deficit (and even a 31-27 deficit with one minute remaining in the game) to take the BCS 34-31.

This drops our official quant fact record to 36-23, although the result was definitely more than a moral victory.  Our research shows the importance of factors related to sports psychology.  Our work highlights factors that are under-weighted by sports analysts and sports fans.  Stay-tuned for several upcoming Super Bowl pieces.


Monday, January 6, 2014

2014 BCS: Auburn vs. Florida State

Based on research with my colleague, Dr. Jay Granat - a psychotherapist and founder of StayInTheZone.com - we have analyzed factors related to sports psychology.  Our series of articles is based on several decades worth of championship results (depending on the sport).  Our work has predicted the winner of major sports championships at a 62% rate (sometimes picking underdogs) -- and is regularly featured in the New York Times.   

Here is our analysis for the 2014 BCS game between Auburn and Florida State.  


Defense
Our research shows that defense is more closely related to winning championships than a high-octane offense.  In college football, the team with the better defense in terms of points scored has won 53.3% of championship games since the B.C.S. began fifteen years ago.  Another key statistic has the team with the better defense – as measured by average yards yielded per rush – winning 71.4% of the games over the past 14 years (since the statistic is widely available).

In defensive points against, Florida State (10.7 points against / game) is ranked better than Auburn (24.0).  Florida State also performed better than Auburn in defensive yards per rush.  Florida State held opponents to 3.1 yards / rush versus Auburn’s 4.6 yards / rush.  Edge: Florida State. 

Consistency
Consistency is an important factor in winning championships across all sports.  In both professional football and college football, average yards per rush is a good indicator of consistency and control of the game.  The team with the better rushing statistic has won 57.1% of the championship games over the past 14 years.  Auburn has run for 6.5 yards per rush, versus Florida State’s 5.7 yards per rush.  Edge: Auburn.

Minimizing Errors
Minimizing mistakes is also crucial to winning the big game.  Statistics show that teams which execute better during the regular season also perform well in championships.  In both college and professional football, the team with fewer interceptions during the regular season has won a large majority of title games.

Over the past 15 years of college football, the team with fewer interceptions has won 60% of national championship games.  Auburn threw 7 interceptions this year, while Florida State threw 13.  Although Florida State passes much more than Auburn, Auburn’s interception rate is also better than Florida State. Edge: Auburn.

Big Game Experience & Coaching Leadership

Big game experience and coaching has a positive relationship with winning championships across all major U.S. sports.  On average, these factors work out to about a 60% success rate in sports we studied.  However, the experience factor, as measured by finals appearances over the past three years, posts just a 4-6 (40%) record since the B.C.S. began.  Auburn won the B.C.S. Championship in 2010.  Florida State has not made a championship final game over the past three years.  Big game experience: Auburn.

Florida State coach Jimbo Fisher has a 3-0 record in major bowls, all with Florida State over the past three years.  On the other hand, this is the first major bowl for Auburn coach Gus Malzahn. Coaching edge: Florida State.

Strength of Schedule
Some sports fans will point out differences in strength of schedule, or S.O.S.  For example, Auburn played Alabama (ranked #1 at the time of the game), Missouri (#5), and a total of six teams ranked in the top 25 in compiling a 12-1 record.  Florida State played Clemson (#3 at the time of the game) and four ranked teams during their 13-0 season. 

Over the past 15 years, the team with the better strength of schedule, as measured by SportsReference.com, has won 53.3% of championships.  It is noteworthy that when the difference in S.O.S. has been greater than 3.0 during this 15 year period, the team with the tougher schedule has gone 4-0 in the championship.  This year’s game features the widest S.O.S. spread since the B.C.S. began.  Auburn has a S.O.S. of 6.62 versus Florida State’s -0.06. 

Summary and Football Simulator

Our championship factors related to concepts of sports psychology, favor Auburn 3-2.  In addition, we model football games based on certain random variables, statistics, and our championship factors.  Our football simulator is a probabilistic Monte Carlo model, based on statistics from the regular season. 

Based on our simulator, the final score that comes up most frequently is: Auburn 35 – Florida State 34. 

Carlton Chin, a portfolio strategist and fund manager, and Jay Granat, psychotherapist, are authors of “Who Will Win the Big Game? A Psychological & Mathematical Method.”  They have previously written about the N.C.A.A. men’s basketball tournament, the Super Bowl, and last year’s B.C.S.