Showing posts with label pools. Show all posts

Monday, January 30, 2017

Super Bowl Square Pool Odds by Quarter - 2017

Our popular Super Bowl Square Pool odds is updated here:

http://quantfacts.sportsblog.com/posts/31841052/2017-super-bowl-square-pool-odds---by-quarter.html


Please visit this blog or our Quant Facts blog for our 2017 Super Bowl prediction!


Monday, January 27, 2014

Super Bowl Square Pool Odds, by Quarter (2014)

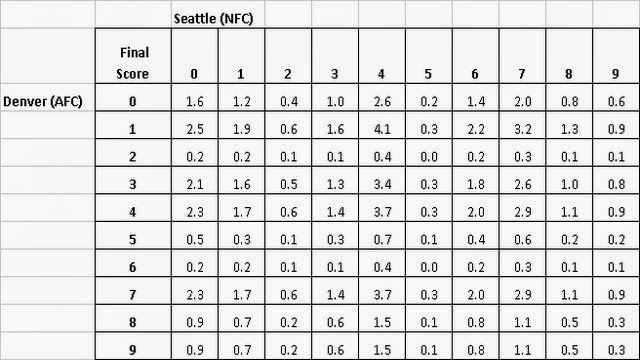
Are you in one of those popular Super Bowl Square Pools?  Here are the probabilities of your numbers winning, for the final score.  In the link below, we also compute the probabilities for the square pool winner for each quarter.  

Quant facts
Square Pool Probabilities - Final Score

If you are participating in a square pool (where only the last digit for each team counts), you will be randomly assigned a digit for each team, such as the Seattle Seahawks (or NFC) 3, and the Denver Broncos (or AFC) 4. Many fans have an idea of what numbers are “good.” Here, we compute square pool probabilities, or odds, based on historical results by quarter.

Most people know that numbers like 7, 3, and 0 are good, due to the key numbers associated with touchdowns and field goals. But how good are these numbers? And what about the 4, 6, or 1? Several years ago, I computed the probabilities of the digits winning for each quarter – based on every Super Bowl ever played. The results were published by the New York Times, in their Super Bowl Sunday spread print edition.


Read more at http://www.rantsports.com/nfl/2014/01/27/2014-super-bowl-square-pool-probabilities-by-quarter/?YhoBfZegjGmcc7rJ.99


Carlton Chin is a fund manager, quant researcher, and sports analytics contributor to Rant Sports.  He has also contributed to the New York Times, Wall St. Journal, and ESPN.  Don La Fronz is a financial advisor and originated the idea for this piece.

Wednesday, March 20, 2013

March Madness Results by Seed for "Round 2"

Now that the field of 64 is all set, we wanted to take a look at how the seeds performed in Round 2, as it is now called.  We computed the results last year, here.

This year, this work was done for us.  Here are the results for the Seeds in Round 2 through last year's tournament.  


      Seed       Wins     Losses      Win %
1 112 0 100%
2 106 6 95%
3 96 16 86%
4 89 23 79%
5 74 38 66%
6 74 38 66%
7 67 45 60%
8 54 58 48%
9 58 54 52%
10 45 67 40%
11 38 74 34%
12 38 74 34%
13 23 89 21%
14 16 96 14%
15 6 106 5%
16 0 112 0%


Read more here:
http://www.sportsquants.com/2013/03/20/march-madness-1-results-seed/

Tuesday, January 29, 2013

Super Bowl Square Probabilities - updated through 1/29/13

by Carlton Chin, Don La Fronz & Paul Lacher

A few years ago, we took a look at the probabilities of the digits winning at the end of each quarter – based on every Super Bowl ever played.  The results were published by the New York Times, here. Below is the entire link:


This year, we refreshed the results to reflect the NFL’s adoption of the two-point conversion since 1994.  We used every Super Bowl – along with Conference Championship games – since 1994.   Similar to three years ago, we computed the probabilities, or odds, at the end of each quarter.  Our findings include information on which team was favored to win the game.   

So, what numbers are good?  Here are some tidbits:
  • For the team that is favored (San Francisco, this year), the best numbers to have for the final score are: 1, 4, and 7.  These numbers each have a 17.9% chance of hitting, based on our data sample. 
  • The best numbers for the underdog’s final score (Baltimore) are 4, 7 and 0 – in that order.
  • The best overall numbers, to win at the end of any quarter – favorite or underdog – are 0, 7, 4, and 3, in that order. 
  • The 0 and 3 are particularly good to have at the end of the first quarter and first half.
  • By the end of the game, the 4 and 7 are the best.
  • The worst numbers are the 2 and 5, but by the end of the game, every number has won in our sample size, since 1994.  
Note that if there is a 0.0% in a given square, it does not mean that this event is impossible.  It just means that during our sample size, that set of numbers has not occurred for the given quarter.  Please keep an eye out for our “Who Will Win” analysis and Monte Carlo simulation of this year’s Super Bowl. Enjoy the game!

(Please click on the charts to enlarge.)

First Quarter - Probabilities


First Half - Probabilities

Third Quarter - Probabilities

Final Score - Probabilities

Special thanks to Don La Fronz who thought of the idea and helped devise the methodology -- and to Paul Lacher, who helped to put this year's article together.  Carlton has been good friends with Don and Paul for many years.

Don La Fronz is a financial advisor at Pell Wealth Partners.  Paul Lacher is a Wall Street veteran with over 20 years in financial services working with brokerage firms, banks, mutual fund companies and transfer agents.  Born and raised in Brooklyn, NY, Paul is a lifelong sports fan who still counts down the days until pitchers and catchers report for spring training -- and wonders, at times, if the NY Jets will ever win another Super Bowl.  Carlton Chin, CFA, is a managing director at Price Asset Management and principal at Adamah/CARAT Capital, specializing in portfolio strategy, quant research, and alternative investment strategies.

This article and the Final Score chart is also here:
Saturday, March 26, 2011

March Madness: Elite 8 Probabilities

The Financial Markets Program at the University of Chicago - together with Carlton Chin, a fund manager - devised a March Madness pool -- that models each game as a financial marketplace.  The pool is being run "round-by-round" so it can generate fresh pricing as each round develops. 

The points awarded for correct selections -- are based on market participant entries.  As a result, the final price for each game can be used as a proxy for the probability of a team advancing to the next round.  Below is a table that shows the final pricing for the current round's match-ups.  It is interesting that our financial marketplace model produced probabilities similar to projections from various sources.  The pool is designed to study:  
  • Financial marketplaces and market pricing.
  • Ideas of game theory.
  • Concepts of contrarian methods.

For more information - please visit the March Madness link at CARATcapital.com.  Please also visit this summary of the March Madness Pool.


Financial Markets Program: Elite 8 Final Prices 
(Proxy for Probability of Advancing to Next Round)

Kansas 72%
VCU      28%

Arizona 55%
U-Conn  45%

North Carolina 52%
Kentucky 48%

Florida 57%
Butler 43%

Wednesday, March 16, 2011

March Madness Bracket Probabilities (2011)

The Financial Markets Program at the University of Chicago - together with Carlton Chin, a fund manager - devised a March Madness pool -- that models each game as a financial marketplace.  The pool is being run "round-by-round" so it can generate fresh pricing as each round develops. 

The points awarded for correct selections -- are based on market participant entries.  As a result, the final price for each game can be used as a proxy for the probability of a team advancing to the next round.  Below is a table that shows the final pricing for the first round's match-ups.  It is interesting that our financial marketplace model produced probabilities similar to projections from various sources, including the New York Times 538 forecast -- even with a relatively small sample size of just under 40 data points.  The pool is designed to study:  

  • Financial marketplaces and market pricing.
  • Ideas of game theory.
  • Concepts of contrarian methods.

For more information - please visit the March Madness link at CARATcapital.com.  Please also visit this summary of the March Madness Pool.


Financial Markets Program: First Round Final Prices 
(Proxy for Probability of Advancing to Next Round)


Region
Seed
Team
Official Final Price (1st Rd)
  SW
1
Kansas
94.80
SW
16
Boston U
5.20


SW
8
UNLV
52.20
SW
9
Illinois
47.80


SW
5
Vanderbilt
53.20
SW
12
Richmond
46.80


SW
4
Louisville
83.90
SW
13
Morehead St
16.10


SW
6
Georgetown
65.60
SW
11
TBD
34.40


SW
3
Purdue
89.25
SW
14
St. Peters
10.75


SW
7
Texas A&M
44.40
SW
10
Florida St
55.60


SW
2
Notre Dame
90.10
SW
15
Akron
9.90


W
1
Duke
92.95
W
16
Hampton
7.05


W
8
Michigan
43.05
W
9
Tennessee
56.95


W
5
Arizona
66.95
W
12
Memphis
33.05


W
4
Texas
77.65
W
13
Oakland
22.35


W
6
Cincinnati
40.20
W
11
Missouri
59.80


W
3
Connecticut
85.40
W
14
Bucknell
14.60


W
7
Temple
50.10
W
10
Penn St
49.90


W
2
San Diego St
90.25
W
15
No. Colorado
9.75


E
1
Ohio St
93.95
E
16
Play-in Winner
6.05


E
8
George Mason
47.60
E
9
Villanova
52.40


E
5
West Virginia
75.35
E
12
Play-in Winner
24.65


E
4
Kentucky
86.90
E
13
Princeton
13.10


E
6
Xavier
48.95
E
11
Marquette
51.05


E
3
Syracuse
83.55
E
14
Indiana St
16.45


E
7
Washington
60.20
E
10
Georgia
39.80


E
2
North Carolina
94.30
E
15
Long Island
5.70


SE
1
Pittsburgh
92.45
SE
16
TBD
7.55


SE
8
Butler
42.20
SE
9
Old Dominion
57.80


SE
5
Kansas St
47.75
SE
12
Utah St
52.25


SE
4
Wisconsin
64.60
SE
13
Belmont
35.40


SE
6
St. Johns
50.30
SE
11
Gonzaga
49.70


SE
3
BYU
78.20
SE
14
Wofford
21.80


SE
7
UCLA
45.95
SE
10
Michigan St
54.05


SE
2
Florida
93.15
SE
15
UC Santa Barb
6.85